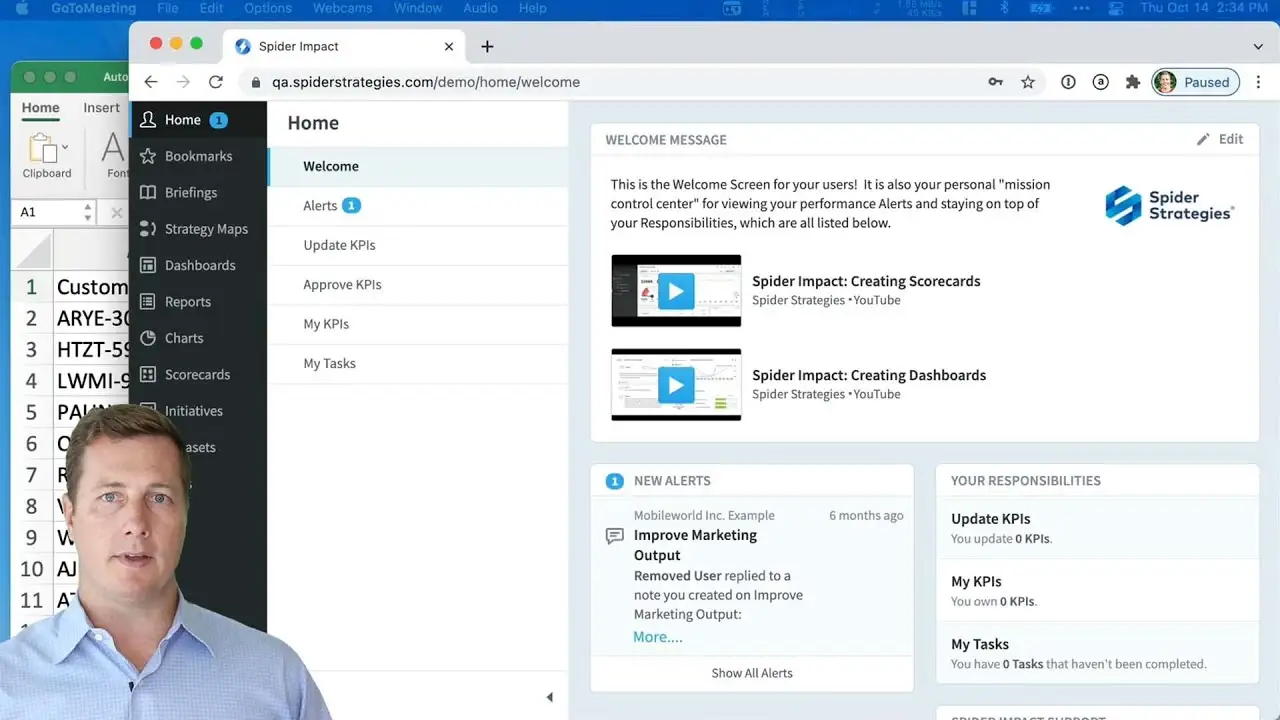
Creating Charts
Learn about how to create charts, including line, bar, pie, area, donut, and many more. Add analytic items like trend lines, forecasts, reference lines and bands, and stacks.
Building
Demo then Free Trial
Schedule a personalized tour of Spider Impact, then start your free 30-day trial with your data.


