Spider Strategies vs. Business Intelligence

One of the most commonly asked questions during our sales process is the difference between our flavor of Business Intelligence (BI) software and traditional BI software. Here's an answer I wrote up for a customer that I thought would be worth sharing. There are two main differences:
1) Data Structure.
Traditional BI software takes your data that's in just about any format and allow you to slice and dice it in just about any way you want. It's a lot like Excel, actually. You can put whatever data you want in different columns, and then create charts and graphs based on that data. Then, when you have the charts and graphs you like, you can add them to dashboards.
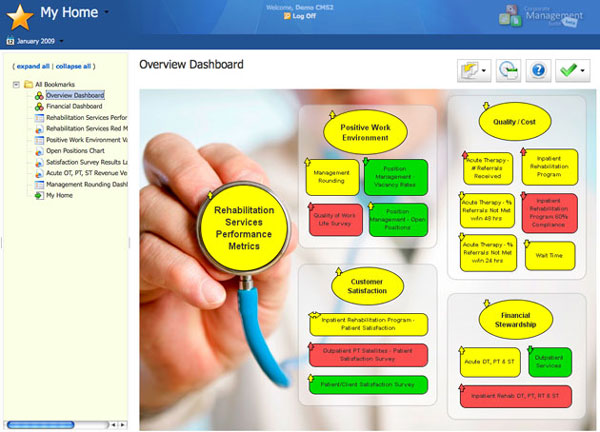
We’re Scorecard/KPI software, and we require a specific kind of data. Our software is all about choosing what you want to measure, setting goals, and then measuring it on a regular basis. You can choose to measure workplace injuries monthly and the software is going to want to know how many injuries there were every month. If you don't have your metric values updated via automatic database feed, the software is going to annoy you with emails every month if you forget to update your metric values. When you do update the values, it's going to give each metric a color rating and a 0-10 score based on whether you met your goals or not.
The disadvantage to our approach is that it only works with things you measure over and over at regular intervals.
The advantages, though, are huge. Once you assume the data is going to be in a specific format, you can do all kinds of things to make the software more powerful and easier to use. You can quickly view your weekly data in quarterly aggregations or go back in time to see how things looked last year. You can quickly compare the performance of different parts of your organization, even though they don't measure the same things. You can even add Facebook-style comments to different metrics. You can ask why no products shipped last week and the shift manager can reply that there was a scheduled machine upgrade. Requiring regularly updated data means our software can be more of an interactive experience.
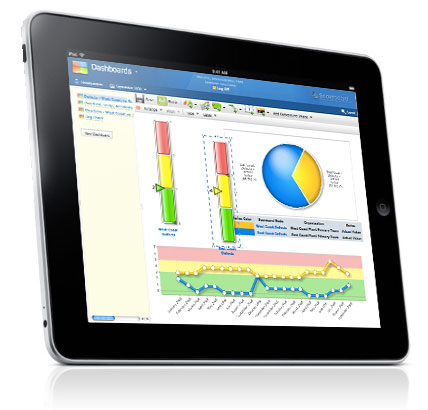
Both software packages create charts, graphs, etc., and then let you analyze the data in dashboards and reports. The fundamental difference between us and them, however, is we only track performance metrics and BI software is much more open ended. If you're looking for software to track the performance of an organization, you're not going to find something much better than our stuff. If, however, you're looking for a tool to visualize a wide variety of data, we’re not really the best candidate for the job.
2) Web-based.
The second major difference between us and BI is that we’re 100% web based. Everything we do is through a web browser talking to a web server. We don't require any plugins or special browsers or anything.
Most BI software is desktop software that you install on a PC. Yes, there's a central server that can store things, but building the charts, reports, and dashboards requires that fat desktop client. Then, when you get things the way you like them, you can publish stuff to the web. This published version is an interactive online snapshot of the data on your desktop. Unfortunately, when it's time to update your online data, you need to load the desktop client, pull in the new data, and republish everything to the web.
With our software there's no such thing as publishing. I'm sure I don't need to explain to you all of the advantages of web based software, but with our stuff as soon as you update a metric value online, all of your reports, dashboards, etc. throughout the system are updated right away.
Demo then Free Trial
Schedule a personalized tour of Spider Impact, then start your free 30-day trial with your data.


